The Sunnvyale City Council meeting of 11/25/2014 took the following actions on item 3 - appeals of building permits to the city council.
The major item - removing the right of citizen appeals to the City Council for "variances to codes" permits - was defeated. If passed appeals on variances (height, density, etc.) could only have gone to the planning commission which approved it.
The secondary item - requiring 2 city council members (instad of just one) to bring an appeal of a building permit before the city council was passed.
Other items were relatively innocuous and passed.
CM Davis and others noted that there had been few if any appeals to the city council brought by council members in the last year so it was a solution looking for a problem. Mayor Griffith replied it was necessary to stop future council member actions bringing endless numbers of appeals to the CC thereby bringing actions to a halt. CM Whittum noted that most cities nearby allow one CM to bring an appeal. Several CMs noted that it was much more difficult to get a second CM to agree without violating the Brown act (which essentially outlaws "back-room" deals). The city lawyer said CMs would have to exercise caution in that regard.
CM Meyering noted "spamming" of appeals had never happened. He then proposed a limit of 1 appeal per year per individual councilmember and only after that requiring two CMs to bring an appeal. That would forestall any future "spamming" of appeals (which have never happened anyway) while letting the occasional one through. That was voted down.
CM Meyering (who is a lawyer) noted that courts had required rationales for some of the provisions being voted on and the items provided no rationales. In reply to which the city attorney said the CC could pass any ordinance it wanted.
The city staff portrayed these as all innocuous measures which would essentially change nothing. Others see it as a start to dismantling the appeals process. The measure was difficult to parse. One friend ran it by a lawyer who said it allowed a lot more than it appeared without appeal beyond the planning commission or director who approved it to begin with.
We will have to see what develops. It may be a foot in the door, or a probe to see how much staff and developers can get away with. It may, in fact, actually *be* innocuous - but that has the smallest likelihood. Why bring up a solution to a problem that has never happened if you don't have something in mind?
Wednesday, November 26, 2014
Friday, November 7, 2014
Costs and Subsidies of Transportation
Summary:
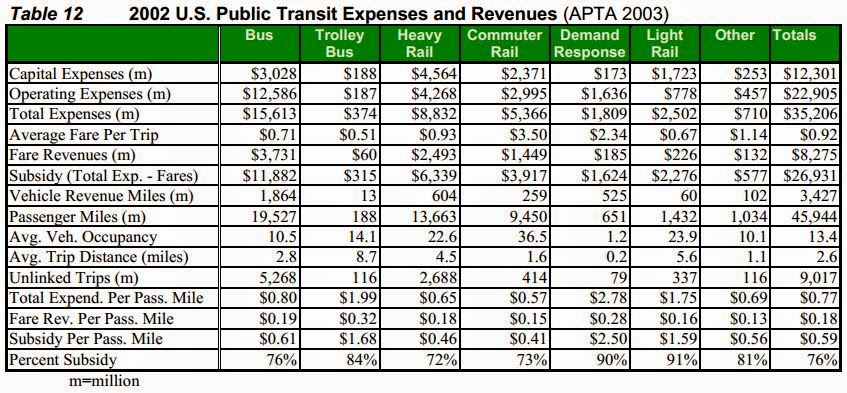
The costs of transportation include many subsidies for public transportation, ranging from 75% subsidy - so the user pays only $2 of the $8 cost of a bus ticket - to over 90% - the $10 cost to ride a light rail costs the user only $1. Subsidies include the cost of parking and road maintenance.
Green house gas emissions and fuel economy are about the same per passenger mile for cars as for public transportation. Air pollution per passenger mile from cars is about double that of buses
None of this should be taken to mean I am against public transit or opposed to subsidies. I am for both, but we should be aware of what are the true costs and revenue sources. Wild claims that one form of transportation is subsidized and the other isn't are obviously false and help no one.
Subsidies for Public Transit:
One source claims that: "Most (public) transit systems in the United States have fare box recovery ratios between 25 and 35%. BART in the San Francisco Bay area is an example of a relatively high fare box recovery at almost 66%".
So typically, 65% to 75% of public transportation costs (buses, commuter trains) are subsidized. If people had to pay the true cost of taking a bus, about $8 per ride, ridership would fall resulting in more congestion which is why people consistently vote to subsidize public transportation that they themselves don't use. CA's subsidies for public transportation are the second highest in the country after NY's. In LA, 67% voted for massive expenditures for public transport - most significantly, a metro-sized subway. Most subsidies come from sales taxes in CA though other states use other taxes.
C.f.: http://publictransport.about.com/od/Transit_Funding/a/The-Basics-Of-Transit-Funding.htm
 (page 24: http://www.vtpi.org/tranben.pdf )
So if the bus fare is $2, the total cost including subsidies is about $8.
There are other indirect subsidies such as public parking, wheelchair access to buses, etc. They have been quantified as well (click table to enlarge):
 (page 75 http://www.vtpi.org/tranben.pdf )
Overall these come to about $0.20 per passenger mile for cars, and about $0.34 per passenger mile for buses. Most of the subsidies for buses are direct while those for cars are indirect (economists call these "externalities") such as noise, roadway land value, pollution, etc. Some of public transport subsidy is for social equity. The air and water pollution from cars averages about twice that of buses.
Society collectively spends to help those needing transportation but unable to provide their own. (click graphic to enlarge):
 Clearly, buses make the most sense during peak hours. A dedicated bus lane that only operated during peak periods would provide the most benefit with the least cost.
Above tables and charts are from http://www.vtpi.org/tranben.pdf
Sources of Subsidies:
Federal and state gas taxes pay for interstate highways. Since trucks from out of state pay those taxes they also pay for the interstate highways they travel on. Weight fees are collected on trucks in CA and when they enter CA since heavier trucks do more damage to roads. That amounted to roughly $1B in 2013-2014.
The CA state base tax of 4.75% on gas is allocated to public transportation:
$0.58 of gas taxes are collected on every gallon of gas to pay for transportation.
http://www.lao.ca.gov/handouts/transportation/2013/Trans_Funding_03_13_13.pdf
By CA Prop 42 passed in 2002, 20% of gas taxes pay to subsidize public transport. Another 40% pay for general roads, the remaining 40% go to local govt's for road and local transport costs.
http://ballotpedia.org/California_Proposition_42,_Allocation_of_Gas_Tax_Revenues_(March_2002)
CA raises and spends about $15B for transportation (including buses, and rail) of which $6B comes from gas taxes. (click on graphic to enlarge)

Part of the state retail sales tax is dedicated to reimburse local govt for public transit including bike paths.
C.f. "Financing Transportation in California: Strategies for Change" at http://escholarship.org/uc/item/7fh2v7
Fuel Economy:


Conclusion:
Public transport is subsidized around the world and in the US. Some forms are so heavily subsidized they might as well be free. In some very heavily congested areas they are free. The relief of traffic congestion makes it worhtwhile to make it free for all in congested urban areas with side benefits of reducing road improvement costs, reducing pollution, and speeding boarding times.
The costs of transportation include many subsidies for public transportation, ranging from 75% subsidy - so the user pays only $2 of the $8 cost of a bus ticket - to over 90% - the $10 cost to ride a light rail costs the user only $1. Subsidies include the cost of parking and road maintenance.
Green house gas emissions and fuel economy are about the same per passenger mile for cars as for public transportation. Air pollution per passenger mile from cars is about double that of buses
None of this should be taken to mean I am against public transit or opposed to subsidies. I am for both, but we should be aware of what are the true costs and revenue sources. Wild claims that one form of transportation is subsidized and the other isn't are obviously false and help no one.
Subsidies for Public Transit:
One source claims that: "Most (public) transit systems in the United States have fare box recovery ratios between 25 and 35%. BART in the San Francisco Bay area is an example of a relatively high fare box recovery at almost 66%".
So typically, 65% to 75% of public transportation costs (buses, commuter trains) are subsidized. If people had to pay the true cost of taking a bus, about $8 per ride, ridership would fall resulting in more congestion which is why people consistently vote to subsidize public transportation that they themselves don't use. CA's subsidies for public transportation are the second highest in the country after NY's. In LA, 67% voted for massive expenditures for public transport - most significantly, a metro-sized subway. Most subsidies come from sales taxes in CA though other states use other taxes.
C.f.: http://publictransport.about.com/od/Transit_Funding/a/The-Basics-Of-Transit-Funding.htm
Another source gives the following table - note the "% Subsidy" on bottom row (click on table to enlarge):
So if the bus fare is $2, the total cost including subsidies is about $8.
There are other indirect subsidies such as public parking, wheelchair access to buses, etc. They have been quantified as well (click table to enlarge):
Overall these come to about $0.20 per passenger mile for cars, and about $0.34 per passenger mile for buses. Most of the subsidies for buses are direct while those for cars are indirect (economists call these "externalities") such as noise, roadway land value, pollution, etc. Some of public transport subsidy is for social equity. The air and water pollution from cars averages about twice that of buses.
Society collectively spends to help those needing transportation but unable to provide their own. (click graphic to enlarge):
Above tables and charts are from http://www.vtpi.org/tranben.pdf
Sources of Subsidies:
Federal and state gas taxes pay for interstate highways. Since trucks from out of state pay those taxes they also pay for the interstate highways they travel on. Weight fees are collected on trucks in CA and when they enter CA since heavier trucks do more damage to roads. That amounted to roughly $1B in 2013-2014.
The CA state base tax of 4.75% on gas is allocated to public transportation:
$0.58 of gas taxes are collected on every gallon of gas to pay for transportation.
http://www.lao.ca.gov/handouts/transportation/2013/Trans_Funding_03_13_13.pdf
By CA Prop 42 passed in 2002, 20% of gas taxes pay to subsidize public transport. Another 40% pay for general roads, the remaining 40% go to local govt's for road and local transport costs.
http://ballotpedia.org/California_Proposition_42,_Allocation_of_Gas_Tax_Revenues_(March_2002)
CA raises and spends about $15B for transportation (including buses, and rail) of which $6B comes from gas taxes. (click on graphic to enlarge)
Part of the state retail sales tax is dedicated to reimburse local govt for public transit including bike paths.
C.f. "Financing Transportation in California: Strategies for Change" at http://escholarship.org/uc/item/7fh2v7
Fuel Economy:
- Plug-in hybrid - 111 person-miles per gallon
- Passenger train - 72 p-mpg
- Airplane - 43 p-mpg
- Bus - 38 p-mpg
- Car - 36 p-mpg
Avg. car ridership is around 1.6 so p-mpg is higher than vehicle mpg. Buses make a lot of empty or mostly empty trips because many runs have to be made in off hours or people won't take the bus during rush hours, since they often need to be able to stay later than rush hour.
C.f., http://truecostblog.com/2010/05/27/fuel-efficiency-modes-of-transportation-ranked-by-mpg/
Green House Gases and Pollution:
So on average, the GHG emissions per person-mile are about 17% higher for buses as for a passenger car.
On a vehicle basis, cars are less polluting than buses, but since buses average about 6 times the passengers, they end up about equal. Obviously hybrid cars and buses are better than standard ones, and all-electric vehicles charged from solar or wind-generated electricity are the cleanest of all.
(page 57 of http://www.vtpi.org/tranben.pdf )
Ridership:
"One study found ... that each 1% increase in density increases transit ridership by 0.22% (PBQD 1996). Destination density (e.g., clustering of employment) tends to have a greater impact on transit ridership than residential density." (click on table to enlarge)
(page 21 http://www.vtpi.org/tranben.pdf )
Since the population of the El Camino cities for BRT (Santa Clara, Sunnyvale, Mountain View, Palo Alto) is less than 500,000 we will likely be limited to about 5% to 6% of residents using the bus. That is a maximum since some people already take the train which counts in that 5%
Since the population of the El Camino cities for BRT (Santa Clara, Sunnyvale, Mountain View, Palo Alto) is less than 500,000 we will likely be limited to about 5% to 6% of residents using the bus. That is a maximum since some people already take the train which counts in that 5%
Conclusion:
Public transport is subsidized around the world and in the US. Some forms are so heavily subsidized they might as well be free. In some very heavily congested areas they are free. The relief of traffic congestion makes it worhtwhile to make it free for all in congested urban areas with side benefits of reducing road improvement costs, reducing pollution, and speeding boarding times.
Monday, November 3, 2014
Bus Rapid Transit - Ridership & Transit Time

- Ridership increases due to BRT can be from -3% to +80% - around 30% is typical.
- Time decrease in journeys is between 26% to 35%
- BRT includes many components, of which a dedicated lane is neither necessary nor sufficient.
- BRTs with dedicated lanes can fail while those without dedicated lanes can be successful.
- BART is very unlikely to be extended parallel to El Camino.
(see also post on pblic transit subsidies here:
Ridership:Most studies of BRT are done by advocates of BRT so it is welcome when one sees a study by the impartial General Accounting Office of the US Congress.
Source: http://www.gao.gov/assets/600/592973.pdf
Even in the same city (LA) results vary from slightly negative ( a decrease) to a very high 70%. Many of the increases are less than 10%. Important to note that LA does not use dedicated bus lanes. So a BRT does not, by itself, guarantee an increase in ridership and even when it does, it may be despite not having a dedicated lane. (click graphic to enlarge).

(http://bussafety.fta.dot.gov/uploads/resource/2986_filename )
Vancouver: 8,000 new riders of which 20% previously used cars and 5% represented new trips."
I have not included cities outside of the US or Canada because car ownership and city layout is much different. Non-US cities still have a central hub for work and shopping, and often a lower car ownership rate while US cities are more dispersed, without a central work-shopping hub,
Another study of BRT (an advocacy paper) showed a ridership increase in LA corridors of 27% (Wilshire) and 42% (Ventura). Weekday corridor revenue service increase was a weighted average of 32%. Source
Travel speed is not very high:
"Arterial Streets:
Express, Bogotá, Curitiba: 19 mph
Metro bus, LA Ventura Blvd., 19mph
Metro bus, LA Wilshire Blvd. and Wilshire Blvd, L.A.: 14 mph
All-Stop – Median Busways, South America: 11-14 mph
Limited Stop Bus Service – New York City: 8-14 mph"
Source:
http://bussafety.fta.dot.gov/uploads/resource/2986_filename
Whether these results can be applied to mixed suburban-office areas like Silicon Valley is an open question as the writers note that:
"Urban areas with more than a million residents and a central area employment of at least 80,000 are good candidates for BRT. These areas generally have sufficient corridor ridership demands to allow frequent all-day service."
The above description does not seem to fit the Palo Alto-Santa Clara corridor. The total 2013 census estimate of population of the proposed El Camino BRT (pop. Palo Alto = 66K, Mountain View = 78K, Sunnyvale = 148K, and Santa Clara = 120K) is 412K. This is well less than 50% of the recommended population. (pop figures from http://quickfacts.census.gov/qfd/states/06/0677000.html)
Further, employment is NOT centrally located but is scattered hither and yon.
In the above photo of the BRT in Guang-Zhou a dedicated lane BRT makes a lot of sense where the population is very high (11M + many millions uncounted transient workers) and very dense and most people still don't own cars. It also has 6 lanes for cars in addition to the two restricted lanes for buses and center walkways.
http://www.metro-magazine.com/news/story/2011/01/chinese-brt-system-wins-sustainable-transport-award.aspx
https://en.wikipedia.org/wiki/Guangzhou#Public_transport
Time:Another study of BRT (an advocacy paper) showed a ridership increase in LA corridors of 27% (Wilshire) and 42% (Ventura). Weekday corridor revenue service increase was a weighted average of 32%. Source
Travel speed is not very high:
"Arterial Streets:
Express, Bogotá, Curitiba: 19 mph
Metro bus, LA Ventura Blvd., 19mph
Metro bus, LA Wilshire Blvd. and Wilshire Blvd, L.A.: 14 mph
All-Stop – Median Busways, South America: 11-14 mph
Limited Stop Bus Service – New York City: 8-14 mph"
Source:
http://bussafety.fta.dot.gov/uploads/resource/2986_filename
Whether these results can be applied to mixed suburban-office areas like Silicon Valley is an open question as the writers note that:
"Urban areas with more than a million residents and a central area employment of at least 80,000 are good candidates for BRT. These areas generally have sufficient corridor ridership demands to allow frequent all-day service."
The above description does not seem to fit the Palo Alto-Santa Clara corridor. The total 2013 census estimate of population of the proposed El Camino BRT (pop. Palo Alto = 66K, Mountain View = 78K, Sunnyvale = 148K, and Santa Clara = 120K) is 412K. This is well less than 50% of the recommended population. (pop figures from http://quickfacts.census.gov/qfd/states/06/0677000.html)
Further, employment is NOT centrally located but is scattered hither and yon.
 |
| BRT in Guang-Zhou, China, pop. 11M |
http://www.metro-magazine.com/news/story/2011/01/chinese-brt-system-wins-sustainable-transport-award.aspx
https://en.wikipedia.org/wiki/Guangzhou#Public_transport
The time savings varies a lot as well from about 5% to almost 35% from the GAO study mentioned above. (click graphic to enlarge).

In the report "BUS RAPID TRANSIT - Synthesis of Case Studies" mentioned above we find the following for transit time savings in N. American cities:
"Reported travel time savings are as follows:
Busways, Freeway Lanes: 32-47%
Seattle’s Bus Tunnel: 33%
Los Angeles Metro Bus: 23-28%"
What Is Bus Rapid Transit?
On page 13 of the Federal Transportation Administration document (here: http://bussafety.fta.dot.gov/uploads/resource/2986_filename ) seven characteristics that constitute a BRT are listed, of which only one is dedicated lanes and this is listed as optional. On page 28 of that same document, (first sentence in section 3.A.3) it states that "BRT service operates successfully in mixed traffic as seen in Los Angeles."
The concern is that some cities are claiming they have a BRT when they don't and it is tarnishing the image of BRTs everywhere. The ITDP has devised a scorecard for BRTs. Of the many, many criteria (each assigned a point value of 1 to 8) a dedicated bus lane is only one and that gets only 8 points, out of a maximum of 100 points. A partial list of the approximately 25 criteria to be met (as seen in the "standards" link above) is shown below (click to enlarge):

Two of the lowest ranking BRTs have dedicated bus lanes, but they do so many other things wrong that they get a failing grade - like 22 points for Delhi's system, and Virginia's Shirley Highway Busway, which is about to be killed. A list of mistakes with point deductions is below.

"Do Bus Rapid Transit Right, And It Won’t Get Killed" by ITDP's staff.
http://nextcity.org/daily/entry/do-bus-rapid-transit-right-and-it-wont-get-killed
A go-slow approach to bringing up BRT would make a lot of sense. No permanent major changes to arterial flow but rather an incremental approach adding those many things listed in the ITDP scorecard which improve speed without impacting traffic flow.
For example,
- Having the ability to pre-pay by buying a ticket at a bus stop would shorten bus stops.
- Elevated entries so wheel-chair and walker users could enter more quickly and easily.
- Distance between stops could be increased so buses stop less often and average higher speeds.
- During rush hour, one could have one bus stop at stations 1-3-5 and the next bus 5 minutes later at stations 2-4-6 so everyone could get close to their destination while buses needn't stop so often.
- Bus lanes could be marked with removable plastic dividers or special markings on the lane like commuter lanes on the freeway. They could be used during rush hours to see if it makes a difference in overall transit speed. There is no necessity to pour lots of concrete to make bus lanes when they really might only help during rush hours. An example (below) is from Newark's BRT. Source https://en.wikipedia.org/wiki/Bus_rapid_transit_in_New_Jersey
 |
| New Jersey BRT without concrete barriers |
 |
| One of San Francisco's BRT proposals along Van Ness |
 |
| BRT with raised platform speeds up boarding of movement impaired |
Extending BART:
It is doubtful more subways will be built in the US given the high cost. (ref: http://www.governing.com/columns/urban-notebook/When-Will-the-US-Build-Another-Subway.html).
To extend BART further is not in the expansion plan at all for the simple reason it would duplicate existing heavy rail (CalTrain) which is closer to most employment centers and in some cases has stations right on El Camino or just a few blocks away from it. See BART map below (click to enlarge).

The Association of Bay Area Governments (ABAG) estimates the entire SF metropolitan area will grow by 2.1 million by 2040 from 7.2M to about 9.3M, a 29% increase over 26 years - 0.9% annual growth rate. http://onebayarea.org/file10044.html
The state of CA estimates the SF area will grow by 1.8M by 2060 from 7.2M to about 9M, a 25% increase over 46 years, a 0.5% annual increase.
http://www.contracostatimes.com/ci_23151275/santa-clara-county-is-fastest-growing-county-population
With this growth comes higher rents and more traffic congestion. But there seems to be little money for expansion. One report estimates "Most of the transportation money in Plan Bay Area is earmarked for maintenance alone and there is still a $20 billion shortfall needed to keep the region’s transit systems in good repair for the next 30 years."
http://www.nbcbayarea.com/news/local/Bay-Areas-Population-Boom-a-Burden-on-Transportation-and-Housing-260805031.html
San Jose's light rail system is clearly a failure to those who study such issues although light rail works well in other areas. Even if it were later to get enough ridership to justify it's cost, building light rail is much more expensive than buses. Saying that because city X has a successful light rail clearly does not guarantee it will work in Silicon Valley.
Ref: http://publictransport.about.com/od/Transit_War/a/Overview-Of-The-Bus-Rapid-Transit-Versus-Light-Rail-Debate.htm
Conclusion:
A BRT might ease traffic congestion. Whether it requires a dedicated lane to do so without a trial is impossible to say. Many characteristics of BRT can be implemented without dedicated lanes. Making it easier and faster to buy tickets and board would be good things to do in any event and should help decrease travel times and increase ridership. A dedicated lane without these improvements will likely fail.
After all the other BRT related improvements have been implemented a dedicated lane for rush hour only using painted road indicators allowing right turning vehicles with posted signs like other BRTs cited above might be the best of both worlds. If a rush-hour dedicated lane designated with paint fails to show further improvement in ridership - and it might - it can easily be undone.
Subscribe to:
Comments (Atom)