Wednesday, December 3, 2014

Surging Seas

A fascinating map by ClimateCentral.org shows the areas expected to be inundated by rising seas.  It is an interactive map so you can set various parameters and get different views - political, population, etc.  By holding down the left mouse button, you can "grab" the map and move it around to survey the area or state.

For California, the map is here:
http://sealevel.climatecentral.org/ssrf/california


What you notice for California is the SF Bay area and up to Sacramento are most at risk.  So. Cal. not very much.  The most at risk area in the South Bay is land near the bay that was filled in and should not have been.  This is due to a 3 foot rise in sea level.  Of course, in the event of a storm there could be unexpected rises over the average.
A 3 foot rise in sea level
If you ever get up to Redwood Shores you may find yourself wondering why anyone would buy one of those nice homes a foot or so above the water. (see below)
Redwood Shores
The most surprising to me was the area inland towards Sacramento.  If things go as projected, Sacramento and Stockton could be receiving container shipments from China, as Oakland is now (admittedly, dredging would be needed).

A 3 foot rise in sea level
A sea wall has been suggested.  It is a terrible idea and won't work.  For one thing, a glance at the map shows it would have to be incredibly huge and with cost overruns and corruption (same thing, really) we can't afford it.  More importantly, it won't be needed most of the time so it will be neglected until all of a sudden a big storm reminds us that "Oops! Maybe we should invest in infrastructure, after all!"  Just as the levees around New Orleans were poorly constructed and neglected before Hurricane Katrina.  C.f. http://en.wikipedia.org/wiki/2005_levee_failures_in_Greater_New_Orleans

(photo from http://www.cnn.com/2012/08/28/us/gallery/katrina-anniversary/ )
Having levees around New Orleans was worse than if there had been no levees as they gave a false sense of security.  See:
http://www.washingtonpost.com/opinions/five-myths-about-hurricane-katrina/2012/08/31/003f4064-f147-11e1-a612-3cfc842a6d89_story.html

What will happen is the govt. flood insurance co. will buy out people in danger of flooding or refuse to insure them so they have to sell - maybe at a loss.  Here is a video on that happening now in Staten Island, one of NYC's boroughs.
http://www.newyorker.com/news/news-desk/hurricane-sandy-retreat-waters-edge
Photo from "New Yorker" video of Staten Island homes being abandoned
California won't get the massive devastation of New Orleans or Staten Island because we don't get hurricanes (though that could change).  But it will be difficult or impossible to get a mortgage or flood insurance after the first few floodings due to storms reveal a pattern.

Here's a photo of a Staten Island home after Hurricane Sandy.

For other areas of the US see:

Wednesday, November 26, 2014

Sunnyvale CC Limits Building Permit Appeals

The Sunnvyale City Council meeting of 11/25/2014 took the following actions on item 3 - appeals of building permits to the city council.

The major item - removing the right of citizen appeals to the City Council for "variances to codes" permits - was defeated.  If passed appeals on variances (height, density, etc.) could only have gone to the planning commission which approved it.

The secondary item - requiring 2 city council members (instad of just one) to bring an appeal of a building permit before the city council was passed.

Other items were relatively innocuous and passed.

CM Davis and others noted that there had been few if any appeals to the city council brought by council members in the last year so it was a solution looking for a problem.  Mayor Griffith replied it was necessary to stop future council member actions bringing endless numbers of appeals to the CC thereby bringing actions to a halt.  CM Whittum noted that most cities nearby allow one CM to bring an appeal.  Several CMs noted that it was much more difficult to get a second CM to agree without violating the Brown act (which essentially outlaws "back-room" deals).  The city lawyer said CMs would have to exercise caution in that regard.

CM Meyering noted "spamming" of appeals had never happened.  He then proposed a limit of 1 appeal per year per individual councilmember and only after that requiring two CMs to bring an appeal.  That would forestall any future "spamming" of appeals (which have never happened anyway) while letting the occasional one through.  That was voted down.

CM Meyering (who is a lawyer) noted that courts had required rationales for some of the provisions being voted on and the items provided no rationales.  In reply to which the city attorney said the CC could pass any ordinance it wanted.

The city staff portrayed these as all innocuous measures which would essentially change nothing.  Others see it as a start to dismantling the appeals process.  The measure was difficult to parse.  One friend ran it by a lawyer who said it allowed a lot more than it appeared without appeal beyond the planning commission or director who approved it to begin with.

We will have to see what develops.  It may be a foot in the door, or a probe to see how much staff and developers can get away with.  It may, in fact, actually *be* innocuous - but that has the smallest likelihood.  Why bring up a solution to a problem that has never happened if you don't have something in mind?

Friday, November 7, 2014

Costs and Subsidies of Transportation

Summary:
The costs of transportation include many subsidies for public transportation, ranging from 75% subsidy - so the user pays only $2 of the $8 cost of a bus ticket - to over 90% - the $10 cost to ride a light rail costs the user only $1.  Subsidies include the cost of parking and road maintenance.

Green house gas emissions and fuel economy are about the same per passenger mile for cars as for public transportation.  Air pollution per passenger mile from cars is about double that of buses

None of this should be taken to mean I am against public transit or opposed to subsidies.  I am for both, but we should be aware of what are the true costs and revenue sources.  Wild claims that one form of transportation is subsidized and the other isn't are obviously false and help no one.

Subsidies for Public Transit:

One source claims that: "Most (public) transit systems in the United States have fare box recovery ratios between 25 and 35%. BART in the San Francisco Bay area is an example of a relatively high fare box recovery at almost 66%".

So typically, 65% to 75% of public transportation costs (buses, commuter trains) are subsidized.  If people had to pay the true cost of taking a bus, about $8 per ride, ridership would fall resulting in more congestion which is why people consistently vote to subsidize public transportation that they themselves don't use.  CA's subsidies for public transportation are the second highest in the country after NY's.  In LA, 67% voted for massive expenditures for public transport - most significantly, a metro-sized subway.  Most subsidies come from sales taxes in CA though other states use other taxes.

C.f.: http://publictransport.about.com/od/Transit_Funding/a/The-Basics-Of-Transit-Funding.htm

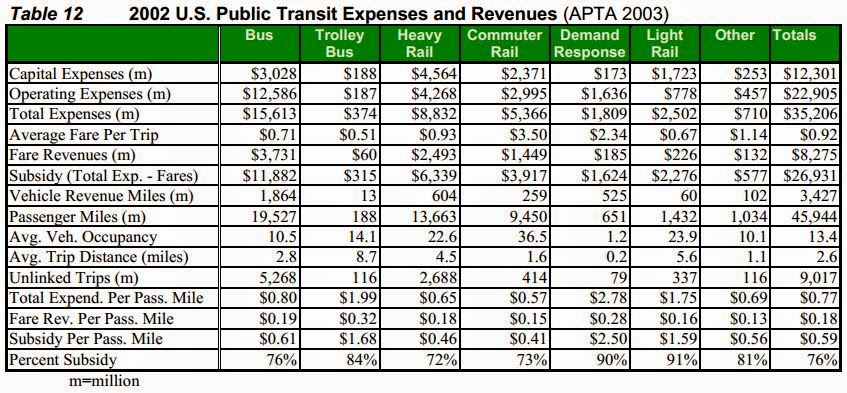
Another source gives the following table - note the "% Subsidy" on bottom row (click on table to enlarge):
(page 24: http://www.vtpi.org/tranben.pdf )
So if the bus fare is $2, the total cost including subsidies is about $8.

There are other indirect subsidies such as public parking, wheelchair access to buses, etc.  They have been quantified as well (click table to enlarge):
(page 75 http://www.vtpi.org/tranben.pdf )

Overall these come to about $0.20 per passenger mile for cars, and about $0.34 per passenger mile for buses.  Most of the subsidies for buses are direct while those for cars are indirect (economists call these "externalities") such as noise, roadway land value, pollution, etc.  Some of public transport subsidy is for social equity.  The air and water pollution from cars averages about twice that of buses.

Society collectively spends to help those needing transportation but unable to provide their own.  (click graphic to enlarge):
Clearly, buses make the most sense during peak hours.  A dedicated bus lane that only operated during peak periods would provide the most benefit with the least cost.

Above tables and charts are from http://www.vtpi.org/tranben.pdf

Sources of Subsidies:

Federal and state gas taxes pay for interstate highways.  Since trucks from out of state pay those taxes they also pay for the interstate highways they travel on.  Weight fees are collected on trucks in CA and when they enter CA since heavier trucks do more damage to roads.  That amounted to roughly $1B in 2013-2014.

The CA state base tax of 4.75% on gas is allocated to public transportation:

$0.58 of gas taxes are collected on every gallon of gas to pay for transportation.

http://www.lao.ca.gov/handouts/transportation/2013/Trans_Funding_03_13_13.pdf

By CA Prop 42 passed in 2002, 20% of gas taxes pay to subsidize public transport.  Another 40% pay for general roads, the remaining 40% go to local govt's for road and local transport costs.
http://ballotpedia.org/California_Proposition_42,_Allocation_of_Gas_Tax_Revenues_(March_2002)

CA raises and spends about $15B for transportation (including buses, and rail) of which $6B comes from gas taxes. (click on graphic to enlarge)

Part of the state retail sales tax is dedicated to reimburse local govt for public transit including bike paths.

C.f. "Financing Transportation in California: Strategies for Change" at http://escholarship.org/uc/item/7fh2v7

Fuel Economy:
  1. Plug-in hybrid  - 111 person-miles per gallon
  2. Passenger train -   72 p-mpg
  3. Airplane           -   43 p-mpg
  4. Bus                   -   38 p-mpg
  5. Car                   -   36 p-mpg
Avg. car ridership is around 1.6 so p-mpg is higher than vehicle mpg.  Buses make a lot of empty or mostly empty trips because many runs have to be made in off hours or people won't take the bus during rush hours, since they often need to be able to stay later than rush hour.

C.f., http://truecostblog.com/2010/05/27/fuel-efficiency-modes-of-transportation-ranked-by-mpg/

Green House Gases and Pollution:

(from page 55 of http://www.vtpi.org/tranben.pdf )

So on average, the GHG emissions per person-mile are about 17% higher for buses as for a passenger car.

On a vehicle basis, cars are less polluting than buses, but since buses average about 6 times the passengers, they end up about equal.  Obviously hybrid cars and buses are better than standard ones, and all-electric vehicles charged from solar or wind-generated electricity are the cleanest of all.
Ridership:

"One study found ... that each 1% increase in density increases transit ridership by 0.22% (PBQD 1996). Destination density (e.g., clustering of employment) tends to have a greater impact on transit ridership than residential density." (click on table to enlarge)
(page 21 http://www.vtpi.org/tranben.pdf )
Since the population of the El Camino cities for BRT (Santa Clara, Sunnyvale, Mountain View, Palo Alto) is less than 500,000 we will likely be limited to about 5% to 6% of residents using the bus.  That is a maximum since some people already take the train which counts in that 5%

Conclusion:

Public transport is subsidized around the world and in the US.  Some forms are so heavily subsidized they might as well be free.  In some very heavily congested areas they are free.  The relief of traffic congestion makes it worhtwhile to make it free for all in congested urban areas with side benefits of reducing road improvement costs, reducing pollution, and speeding boarding times.

Monday, November 3, 2014

Bus Rapid Transit - Ridership & Transit Time

Summary:
  1. Ridership increases due to BRT can be from -3% to +80% - around 30% is typical. 
  2. Time decrease in journeys is between 26% to 35%
  3. BRT includes many components, of which a dedicated lane is neither necessary nor sufficient.
  4. BRTs with dedicated lanes can fail while those without dedicated lanes can be successful.
  5. BART is very unlikely to be extended parallel to El Camino.
(see also post on pblic transit subsidies here:
Ridership:

Most studies of BRT are done by advocates of BRT so it is welcome when one sees a study by the impartial General Accounting Office of the US Congress.
Source:  http://www.gao.gov/assets/600/592973.pdf

The argument for BRT is usually that by decreasing bus transit times, it will increase ridership and reduce traffic congestion.  The GAO's study shows mixed results.

Even in the same city (LA) results vary from slightly negative ( a decrease) to a very high 70%.  Many of the increases are less than 10%.  Important to note that LA does not use dedicated bus lanes.  So a BRT does not, by itself, guarantee an increase in ridership and even when it does, it may be despite not having a dedicated lane. (click graphic to enlarge).
In the Federal Transport Agency's report "BUS RAPID TRANSIT - Synthesis of Case Studies" (pro-BRT) we find the following for ridership increases in N. American cities:
(http://bussafety.fta.dot.gov/uploads/resource/2986_filename )

"Los Angeles: 26 to 33% gain of which 1/3 were new riders.
Vancouver: 8,000 new riders of which 20% previously used cars and 5% represented new trips."

I have not included cities outside of the US or Canada because car ownership and city layout is much different.  Non-US cities still have a central hub for work and shopping, and often a lower car ownership rate while US cities are more dispersed, without a central work-shopping hub,

Another study of BRT (an advocacy paper) showed a ridership increase in LA corridors of 27% (Wilshire) and 42% (Ventura).  Weekday corridor revenue service increase was a weighted average of 32%.  Source
Travel speed is not very high:

"Arterial Streets:
 Express, Bogotá, Curitiba: 19 mph
 Metro bus, LA Ventura Blvd., 19mph
 Metro bus, LA Wilshire Blvd. and Wilshire Blvd, L.A.: 14 mph
 All-Stop – Median Busways, South America: 11-14 mph
 Limited Stop Bus Service – New York City: 8-14 mph"

Source:
http://bussafety.fta.dot.gov/uploads/resource/2986_filename

Whether these results can be applied to mixed suburban-office areas like Silicon Valley is an open question as the writers note that:

"Urban areas with more than a million residents and a central area employment of at least 80,000 are good candidates for BRT. These areas generally have sufficient corridor ridership demands to allow frequent all-day service."

The above description does not seem to fit the Palo Alto-Santa Clara corridor.  The total 2013 census estimate of population of the proposed El Camino BRT (pop. Palo Alto = 66K, Mountain View = 78K, Sunnyvale = 148K, and Santa Clara = 120K) is 412K.  This is well less than 50% of the recommended population. (pop figures from http://quickfacts.census.gov/qfd/states/06/0677000.html)

Further, employment is NOT centrally located but is scattered hither and yon.
BRT in Guang-Zhou, China, pop. 11M
In the above photo of the BRT in Guang-Zhou a dedicated lane BRT makes a lot of sense where the population is very high (11M + many millions uncounted transient workers) and very dense and most people still don't own cars.  It also has 6 lanes for cars in addition to the two restricted lanes for buses and center walkways.
http://www.metro-magazine.com/news/story/2011/01/chinese-brt-system-wins-sustainable-transport-award.aspx
https://en.wikipedia.org/wiki/Guangzhou#Public_transport

Time:

The time savings varies a lot as well from about 5% to almost 35% from the GAO study mentioned above. (click graphic to enlarge).

In the report "BUS RAPID TRANSIT - Synthesis of Case Studies" mentioned above we find the following for transit time savings in N. American cities:

"Reported travel time savings are as follows:
Busways, Freeway Lanes: 32-47%
Seattle’s Bus Tunnel: 33%
Los Angeles Metro Bus: 23-28%"

What Is Bus Rapid Transit?

On page 13 of the Federal Transportation Administration document (here: http://bussafety.fta.dot.gov/uploads/resource/2986_filename ) seven characteristics that constitute a BRT are listed, of which only one is dedicated lanes and this is listed as optional.  On page 28 of that same document, (first sentence in section 3.A.3) it states that "BRT service operates successfully in mixed traffic as seen in Los Angeles."

The very much pro-BRT Institute for Transportation and Development Policy (ITDP) (https://www.itdp.org/) has issued a set of standards that need to be met to qualify as a BRT.  https://www.itdp.org/?s=brt+standard

The concern is that some cities are claiming they have a BRT when they don't and it is tarnishing the image of BRTs everywhere.  The ITDP has devised a scorecard for BRTs. Of the many, many criteria (each assigned a point value of 1 to 8) a dedicated bus lane is only one and that gets only 8 points, out of a maximum of 100 points.  A partial list of the approximately 25 criteria to be met (as seen in the "standards" link above) is shown below (click to enlarge):

Two of the lowest ranking BRTs have dedicated bus lanes, but they do so many other things wrong that they get a failing grade - like 22 points for Delhi's system, and Virginia's Shirley Highway Busway, which is about to be killed.  A list of mistakes with point deductions is below.


Cf: the marvelously titled
"Do Bus Rapid Transit Right, And It Won’t Get Killed" by ITDP's staff.
http://nextcity.org/daily/entry/do-bus-rapid-transit-right-and-it-wont-get-killed

A go-slow approach to bringing up BRT would make a lot of sense.  No permanent major changes to arterial flow but rather an incremental approach adding those many things listed in the ITDP scorecard which improve speed without impacting traffic flow.

For example,
  1. Having the ability to pre-pay by buying a ticket at a bus stop would shorten bus stops.  
  2. Elevated entries so wheel-chair and walker users could enter more quickly and easily.  
  3. Distance between stops could be increased so buses stop less often and average higher speeds.
  4. During rush hour, one could have one bus stop at stations 1-3-5 and the next bus 5 minutes later at stations 2-4-6 so everyone could get close to their destination while buses needn't stop so often.
  5. Bus lanes could be marked with removable plastic dividers or special markings on the lane like commuter lanes on the freeway.  They could be used during rush hours to see if it makes a difference in overall transit speed.  There is no necessity to pour lots of concrete to make bus lanes when they really might only help during rush hours.  An example (below) is from Newark's BRT.  Source https://en.wikipedia.org/wiki/Bus_rapid_transit_in_New_Jersey
New Jersey BRT without concrete barriers
One of San Francisco's BRT proposals along Van Ness
San Francisco did an extensive study of BRT options along Van Ness Ave. of which one is seen above.  Ref: http://www.sfcta.org/van-ness-avenue-bus-rapid-transit-feasibility-study

BRT with raised platform speeds up boarding of movement impaired
None of this requires massive expenditures or drastically re-organizing cities or requires pouring lots of cement.  Some cynics might argue that this removes the motivation for many of BRT's advocates who want a big ticket project to gloss their resumes or reward contractor campaign supporters.  But I am not so cynical and believe that honest differences of opinion can be approached with an eye to compromise and a gradual approach to alleviate legitimate concerns.

Extending BART:

It is doubtful more subways will be built in the US given the high cost.  (ref: http://www.governing.com/columns/urban-notebook/When-Will-the-US-Build-Another-Subway.html).

The Bay Area Rapid Transit (BART) system is one of the most successful in the US.  It is currently being extended further to the Berryessa area and Warm Springs (Fremont) and eventually to Santa Clara.  The Berryessa extension is 10 miles and will cost an estimated $930M or $93M/mile.  (ref: http://www.vta.org/bart/faq#g) The Warm Springs extension will be 5.4 miles and will cost $890M or about $164M/mile.  (http://www.bart.gov/about/projects/wsx )

To extend BART further is not in the expansion plan at all for the simple reason it would duplicate existing heavy rail (CalTrain) which is closer to most employment centers and in some cases has stations right on El Camino or just a few blocks away from it.  See BART map below (click to enlarge).

The Association of Bay Area Governments (ABAG) estimates the entire SF metropolitan area will grow by 2.1 million by 2040 from 7.2M to about 9.3M, a 29% increase over 26 years -  0.9% annual growth rate.  http://onebayarea.org/file10044.html

The state of CA estimates the SF area will grow by 1.8M by 2060 from 7.2M to about 9M, a 25% increase over 46 years, a 0.5% annual increase.
http://www.contracostatimes.com/ci_23151275/santa-clara-county-is-fastest-growing-county-population

With this growth comes higher rents and more traffic congestion.  But there seems to be little money for expansion.  One report estimates "Most of the transportation money in Plan Bay Area is earmarked for maintenance alone and there is still a $20 billion shortfall needed to keep the region’s transit systems in good repair for the next 30 years." 
http://www.nbcbayarea.com/news/local/Bay-Areas-Population-Boom-a-Burden-on-Transportation-and-Housing-260805031.html

San Jose's light rail system is clearly a failure to those who study such issues although light rail works well in other areas.  Even if it were later to get enough ridership to justify it's cost, building light rail is much more expensive than buses.  Saying that because city X has a successful light rail clearly does not guarantee it will work in Silicon Valley.
Ref:  http://publictransport.about.com/od/Transit_War/a/Overview-Of-The-Bus-Rapid-Transit-Versus-Light-Rail-Debate.htm

Conclusion:

A BRT might ease traffic congestion.  Whether it requires a dedicated lane to do so without a trial is impossible to say.  Many characteristics of BRT can be implemented without dedicated lanes.  Making it easier and faster to buy tickets and board would be good things to do in any event and should help decrease travel times and increase ridership.  A dedicated lane without these improvements will likely fail.

After all the other BRT related improvements have been implemented a dedicated lane  for rush hour only using painted road indicators allowing right turning vehicles with posted signs like other BRTs cited above might be the best of both worlds.  If a rush-hour dedicated lane designated with paint fails to show further improvement in ridership - and it might - it can easily be undone.

Wednesday, October 29, 2014

The US, and the Sahara - Germany and Alaska

There was a consortium ("Desertec") to put up solar panels in the North African Desert and ship the electricity provided under the Mediterranean to Europe.  This is a great idea since North Africa gets so much more sun than Europe that it more than makes up for the transmission losses and cost of setting up the cable.  What most people don't realize is that the southern half of the US is on the same latitudes as N. Africa and the Sahara.

Algiers and Fresno, CA are at 36' 40", Miami, FL (25' 46") is only one degree north of Riyadh, Saudi Arabia (24' 38")

And sunny Spain or sun-drenched Greece?  Madrid (40' 23") is to the north of Columbus, Ohio (40' 00") while Athens (37' 58") is to the north of Richmond, VA (37' 33").

Anyone looking into renewable generation of electricity (hydro, wind turbines and solar, mainly) knows Germany is the world leader in getting electricity from the sun (38 GW - more than the US, Japan, or China).  But if you look at the amount of sun Germany gets, it looks worse than Alaska's (click graphic below to enlarge):

Munich, 48' 08", is in southern Germany and it is to the north of Seattle WA (47' 37").  Most of Germany is on a parallel range with Canada.

The US has a huge potential for solar generation of electricity.  We have no need to burn coal or natural gas.

The stone age didn't end because people ran out of stones, but because something better was invented.

All new construction should have solar panels built in.

Ref:
Desertec:
http://en.wikipedia.org/wiki/Desertec

Latitudes of large US cities:
http://www.infoplease.com/ipa/A0001796.html

Other cities' latitudes are from Wikipedia entry on that city.

German solar electricity generation
http://en.wikipedia.org/wiki/Solar_power_in_Germany

Friday, October 3, 2014

GHG: Sources and Solutions

Summary: The world needs to eliminate 80% of Green House gas (GHG) emissions by 2050 and 100% by 2100 to avoid catastrophic warming.  Eliminating 100% by 2100 is necessary because while the oceans have been absorbing increasing man-made GHG's for many years, once the CO2 levels in the atmosphere start to drop the oceans will re-emit those GHG's they previously absorbed until levels balance. US data show no one item as the key source of CO2 (and "equivalent" GHGs like methane and nitrogen oxides) emissions.  Personal autos = 18%.  ALL Residential use = 19%.  Commercial airplane emissions = 3%.  ALL farming = 3%.

I am using the US Dept of Energy 2014 World Energy Outlook in reference to US GHG emissions. Notes on data at the end.   (Source links at end).

Green House Gas Emissions by Sector: Looking at the actual emissions it is clear that there is no one end use that is the main contributor to GHG emissions.  If we look at each sector in detail, we find only a few large uses, none of which by itself will acheive the 80% reduction in GHG needed. (Click on graphic below to enlarge):

Manufacturing: Manufacturing = 22% of GHG (not including power generation or farming).  No one industry can be changed to fix it all.  For example, the recent focus on GHG emissions has prompted refineries to use butane and propane for power generation instead of burning it off.  This could have been done years ago, but without attention being paid to it, nothing happened.  (Click on graphic below to enlarge):
Residential:  Heating is the biggest residential GHG emitter, but even that is only 4.2% of total US GHG emissions.  Residential lighting is responsible for only 1.8% of GHG emissions.  (Click on graphic below to enlarge):
The key point one gets from the residential energy use data is that there is No. One. Thing. we can do to make a difference.  It must be an all-of-the-above effort.  Replace gas appliances with electric, put in roof-top solar panels wherever practical, source external power from renewables like wind, wave and utility scale solar with massive banks of back-up electrical storage (batteries, stored hydro, etc.).

Transportation:  At 32% of GHG emissions, this is the biggest single contributor to GHG.  ALL personal autos (including SUVs, and mini-vans) are responsible for 18% of US GHG emissions - the same as all residential use.   Air transport is 3%, including international and transcontinental. (Click on graphic below to enlarge):
We could replace ALL our cars with electric vehicles (an enormous step in the right direction) yet we would not be even close to the 80% reduction in GHG we need.  High Speed Rail is touted as a big saver of energy but even if HSR replaced ALL air travel (including transcontinental and international - a bit unlikely) the maximum 3% decrease (more realistically about 0.5%) in total US GHG emissions is trivial.  The many billions spent on building and subsidizing HSR in CA would have a much bigger impact on GHG emissions if it went to extend BART, and the LA Metro-Rail or subsidize solar panels and wind farms.  http://en.wikipedia.org/wiki/Metro_Rail_(Los_Angeles_County)

The average American drives 37 miles per day (13,476 miles per year) which at typical bicycle speeds of about 9 miles per hour would mean over 4 hours per day biking to work, shopping, taking kids to soccer and piano lessons, etc.  Not going to happen.

The Chevy Volt (below) is a Plug-in Hybrid Electric Vehicle (PHEV).
The Volt can go 40 miles at highway speeds on battery power alone and then switch over to its gasoline-powered engine.  This 40 miles covers 80% of typical American daily driving without burning fossil fuels.   Volt owners talk of visiting a gas station once every 3 months.  Recall that the goal is an 80% reduction of GHG by 2050 to stop global warming.  With PHEV's like the Chevy Volt, the Ford "Energi" line, etc., the 80% reduction goal is achieved as far as cars are concerned.   

Currently the Volt is $34,000 but a $7,500 federal tax credit and a $2,500 CA credit lower the net price to $24,000.  Lowering the price so it no longer needs tax credits along with adding range will be done in 5 years by current battery development.  I mention the Volt because it is the only PHEV to achieve the all electric 40 mile range and is currently the most popular PHEV.

Another option is Bio-Fuels.  While corn-based ethanol is the most well-known, farmed algae generates 20X the oil per acre as corn, and is easier to refine.  It uses salty water and produces pure H2O as a byproduct.   Commercial jets have been experimentally flown across the country on 100% algae-derived bio-fuel.  The US Navy expects to have a "Green Fleet" operational in 2016 running on bio-fuel blends.  Biofuels result in CO2 emissions but since the algae took CO2 out of the atmosphere to make the oil it is "carbon neutral".
Commercial: Commercial use (restaurants, stores, office buildings) generates another 17% of GHG.  Nothing jumps out as a big contributor, but clearly every aspect can be electrified with electricity generated by renewable sources. (Click graphics to enlarge)
Miscellaneous: Everything else accounts for 12% of GHG.   (Click graphics to enlarge)
That 12% includes much maligned agriculture.  Some think that if everyone became vegans and stopped drinking milk, our climate would be saved.  Not even close.  Farming is 1.2% of GHG emissions and some of that comes from transporting food to the stores.  Farm animals emit 25% of the GHG as methane but much of that can be (and sometimes is) recaptured and used for power generation.  Of the GHG from dairy farms, 25% is methane, 25% is from transport, and the rest is from farm machinery, lighting, heating, etc..  The dairy industry agreed to cut GHG emissions 25%. Nothing wrong with being a vegan, but it won't do much to stop GHG emissions. (Click picture to enlarge)

The US has a special responsibility to reduce GHG because every man, woman, and child in the US emits more than double the CO2 of any other large country.  (Click graphics to enlarge)
The US and Europe have been pouring CO2 into the atmosphere for far longer than other areas and have a special responsibility to do more to clean up.
The US and Western Europe (US + EU25 + Germany + the UK + France) are responsible for 73% of the CO2 emitted between 1850 and 2000

Our future will be whatever we make it.

Sources:
The data can be confusing because different sources give different numbers.  A lot of numbers are educated guesses, and there are wide variances in how to equate different GHGs like methane, CH4, and carbon dioxide, CO2.  Some data refers to source (like power plants) , and some to users (like residential use), and some mix them up in a confusing way.  For example, electricity generation is sometimes seen as a huge slice of the pie.  But electricity is generated for a user and I have focused on that user, since the source will evolve from the centralized plant to be on every farm, house, and office building.  In addition, world-wide GHG sources are very different from US sources.  Here, the US is the focus.  The data from different sources generally agree within 10%.

Source for charts is US Energy Information "Agency Energy Outlook 2014" http://www.eia.gov/forecasts/aeo/

The data for the charts above are taken from "table 19" downloadable in Excel and PDF format below:
http://www.eia.gov/forecasts/aeo/tables_ref.cfm

List of countries and GHG emission per capita:
http://data.worldbank.org/indicator/EN.ATM.CO2E.PC

How much reduction in GHG emissions is necessary?
  1. IPCC says 40% to 70% by 2050 and 100% by 2100.  Maybe even negative by 2100 - eliminating GHG from the atmosphere that are already emitted:  http://www.climatecentral.org/news/major-greenhouse-gas-reductions-needed-to-curtail-climate-change-ipcc-17300
  2. About 80% by 2050 says a presidential document  http://www.climatecommunication.org/wp-content/uploads/2011/08/presidentialaction.pdf
  3. NYC is committing to 80% reduction by 2050:  http://www1.nyc.gov/office-of-the-mayor/news/451-14/mayor-de-blasio-commits-80-percent-reduction-greenhouse-gas-emissions-2050-starting-with#/0
  4. The World Resources Institue thinks the US can make it 83% by 2050 with aggressive action  http://www.wri.org/publication/can-us-get-there-here
Avg US driving mileage:
https://www.fhwa.dot.gov/ohim/onh00/bar8.htm

Avg. bicycle speed:
http://en.wikipedia.org/wiki/Bicycle_performance#Typical_speeds  .

Biofuels:

US Navy "Green Fleet"

Capturing methane from dairy farms:


Friday, September 5, 2014

Where's My Algae-Powered Jet-Pack?

There is a math formula called the "logistics curve/equation" which pretty accurately models population growth including technological innovations growth. It starts slowly but rises exponentially to about the 50% saturation level before leveling off at the point where everyone has a cell phone, or all steam engines are replaced with diesel or (whatever). 
(Click to enlarge)
(from: http://jasss.soc.surrey.ac.uk/16/4/7.html)


Applied to renewable technology, it could be the point where everyone has an electric car, all houses are covered with solar panels with battery backup, and all central power stations rely on wind, tides, currents and sun, while algae-based oils power airplanes.


You can see this for phones here (Click to enlarge):
For 2008 they made this projection for world-wide cell phone use (Click to enlarge):
http://stats.areppim.com/stats/stats_mobile.htm
By the end of 2013 we can see the 2008 projection was dead accurate (Click to enlarge):
I would guess we are near the bottom of the logistics curve for PV, EV, and Wind - around 2%-3% penetration - where it is just about to take off.  Roughly the equivalent of 1990 on the above cell phone charts when cell phones were symbols of wealth and privilege.  See Gordon Gekko from the movie "Wall Street"
So rich and pwoerful he has a private helicopter, yacht and "Gasp!" a cell phone!
It took less than 25 years for cell phones to go from that level to a dollar-three-ninety-eight at 7-11 world-wide!  So the future looks good!

But not as good as we would like.  I estimate solar generation alone, even at growth rates greater than those seen to date, will replace only 50% of electricity generation by 2032, more reasonably by 2040.  Countries need to agree to an 80% reduction in Green House Gas (GHG) emissions with large developed countries (the G8) reducing 2.5%/year starting in 2012 and developing countries coming in 10 years later.  See:

Annual global growth in Photo-voltaic solar cell capacity is between 41% and 48% but capacity is *not* the total electricity generated since PV capacity depends on the sun.  Currently 10%-20% is a rough number for capactity utilization for PV solar.  See:

and for solar capacity utilization:


To estimate the growth rate of cumulative installed solar panel generated electricity, consider that installed PV capacity grew from P0 = 3.7 GWh (Gigawatt-hrs) in 2000 (“t” = 0) to P = 128 GWh in 2012 (t = 12). http://en.wikipedia.org/wiki/Solar_power#Photovoltaics

Using the formula for exponential growth P(t) = P0er(t)  for the population (P(t) as a function of time with
growth rate of “r” and an initial population of P0. This gives  128 = 3.7er(12).  Where r = the rate of growth and t = time = 12.  Taking the natural log of both sides gives:

 (1/12) ln(128/3.7) = r = (1/12)ln(34.6) = 0.295 = 29.5% CAGR

Let K (max possible solar electricity production) be the current 2013 global energy consumption of 840TWh (Terawatt-hours) = 840,000 GWh.  See:

This doesn’t allow for the possibility of electric vehicles replacing transportation energy consumption but has the advantage of simplicity.

The PV generated numbers are too small to be usable in the logistic function but we can estimate the time to hit 50% of that 840,000 GWh using pure exponential growth at a rate of 29.5%.  To find the time "t" when  P(t) = 1/2 (840 TWh) we get:
420,000 = 3.7e0.295(t).  

Solving for "t" by taking natural log "ln()" of both sides gives t = 39.5 years = 2040.

Taking a more optimistic rate of 41% growth rate (doubling every two years) starting from 2013 gives:

420,000 = 128e0.41(t)

Solving for t by taking “ln()” of both sides again gives t = 19.7 years from 2013 or 50% carbon free energy by 2033.

We need to do better, and I cross my fingers that battery-backed solar will cross a magic threshold to become cheaper than coal and gas soon.

The most hopeful thing I've seen is a "climate swerve". See NY Times article http://www.nytimes.com/2014/08/24/opinion/sunday/the-climate-swerve.html  Basically, it seems that things are getting so obviously very weird in terms of weather that global warming is no longer an abstract concept.  People and animals are dying around the world from floods, drought, and heat waves to the point that a lot of people have started to get off the fence and demand action from their politicians.

Wednesday, June 4, 2014

Climate Change & Renewables - 8:Solar

Science of Solar Power

(If the science/technology of solar power is not of interest, skip this and go to the Development  part below) 

Solar mostly means Photovoltaic (PV) cells.  There are other forms of drawing energy from the sun but they have insignificant market share.  PV cells are the first really new way to generate electricity.  All the other ways involve turning a shaft which turns wires inside powerful magnets to generate electrical current.  This was first conceived in the early 1800's by Michael Faraday and others.  http://en.wikipedia.org/wiki/Electric_generator


To turn the wires one can direct running water (from hydro-electric dams), or wind, over a turbine to turn a shaft which turns the wires between electromagnets.  One can also boil water with coal, wood, oil, gas or controlled nuclear reaction and use the steam jet to turn a turbine which turns the wires. In the diagram below I've highlighted the steam generator and turbines in a typical nuclear reactor.  A nuclear power power plant is really just a big steam generator.  Click on the diagram to enlarge.


PV differs from all these other ways of making electricity.  PV uses light falling on atoms to give electrons enough energy to leave their atoms and move to a positively charged area.  That flow of electrons is electricity.  The photoelectric effect was discovered by Heinrich Hertz in 1887.  http://physics.info/photoelectric/

Einstein explained what happens in 1905 and won the Nobel prize for it. The basic idea is that energy, in the form of visible light, (or X-rays, or microwaves, or infra-red radiation, or etc.) travels in little packets.  An electron that absorbs a packet with enough energy will break free of it's atom and travel freely in the space between atoms.  If a single packet has not enough energy the electron cannot break free.  This is important because it is irrelevant how much energy you shine on a PV cell if the frequency is too low.  So one packet (= "quantum") of energy of the right frequency will free an electron.  A million packets, each with too little energy (= "frequency") will do nothing.  The "light" falling on the PV that dislodges the electrons is most commonly infra-red (invisible to humans) so clouds do not get in the way.
The Red Wave has too little energy to free a Potassium electron.  The Green and Purple rays have enough energy.  The energy above the minimum needed gives the electron more speed (velocity "v").
The most popular types of PV cells at the moment are using the same technology we use for integrated circuits - Silicon with impurities like Boron and Phosphorus added in very small amounts (1 Boron or Phosphorus atom for every million or so Silicon atoms) to provide the extra electrons and positive "holes" needed for current.  There are other novel ways of making solar cells but they are not yet a market reality.  A pretty decent explanation of silicon solar cells is here:
http://science.howstuffworks.com/environmental/energy/solar-cell.htm


Two other types of solar power generation are worth mentioning although they are currently too costly to gain much market share.  One is Concentrated Solar Power (CSP) where a set of mirrors concentrates the sun at a container of salt raising it to a high enough temperature to melt the salt.  The molten salt boils water to turn a turbine and make electricity.  This is not yet economical on its own but can be important as a large energy storage device when wind and solar are not up to the demand for electricity.


One CSP installation (in photo above in Spain) is discussed here:

The other form of solar power is Concentrating Photovoltaics (CPV) where small optical magnifier and concentrator lenses are embedded around solar cells.  This is more complicated to make and does not yet yield enough advantage in electricity generation to make up for the added manufacturing cost.  That will change over time as experience is gained and steady incremental cost savings are realized.
C.f.

Development

Photovoltaic solar cells have been around for quite a while but only started showing up in electrical generation data the last 3-4 years as anything other than rounding errors.  Recent price drops seem to have crossed some threshold and solar is quickly growing in many countries.  I have included only Germany and Italy in the following graph because those two countries alone represented over 50% of the world-wide installed Solar Cell capacity in 2011. By 2012 those two had almost doubled their installed capacity.  Other countries like the US are growing fast as well but from such a small installed base that they wouldn't be visible on the graph compared to Germany and Italy.  Examining German and European PV development is of interest because they are far ahead in solar and renewables so give insight to the future for the rest of the world.
The most recent data from the USEIA (US Energy Information Agency) only goes to 2011-2012 for most countries.  The growth of solar is so explosive that 2011 is ancient history,    If the total worldwide PV Solar Cell growth continues at it's current 56% annual growth rate, PV Cells will overtake Hydroelectric generation world-wide by roughly 2026.  PV overtook Hydroelectic in Germany in 2011.  See chart below from 
http://www.ise.fraunhofer.de/en/publications/veroeffentlichungen-pdf-dateien-en/studien-und-konzeptpapiere/recent-facts-about-photovoltaics-in-germany.pdf
:

PV installation in Germany and Italy slowed in 2013.  In Italy, because the austerity program imposed on the EU by the European Central Bank and other lenders caused Italy to stop it's tax breaks and subsidies for PV.  PV installation slowed in Germany because the traditional centralized power companies stock price sank to very low values, so the German govt. instituted a number of tax measures to slow the spread of PV installation.  In addition, the high number of PV installed generation lowered the cost of electricity during the day and raised it at night thereby lengthening the payback time of PV systems.  There are also statutory limits on the percentage of solar power allowed in the grid.  From previous document link.

One projection is that improved storage systems (batteries) will make PV installation viable again as it enables PV installations to store energy and sell it at peak rates, thereby decreasing payback time and leveling price fluctuations during the day.
C.f., 
http://www.pv-magazine.com/news/details/beitrag/solar-power-storage-system-sales-set-to-soar-in-germany_100015289/#axzz33h7gckZC

The traditional German power generation cos. pay a surcharge on the electricity they sell to help pay for renewable installation.  An indirect subsidy designed to attain aggressive goals of 80% renewable energy by 2050 (chart below from previous link).

The following shows the current cost of energy in Germany as of 11/2013.  Clearly coal is cheapest (the dirtiest coal is the cheapest coal) but onshore wind is now competitive and PV at the utility level is nearly competitive.  (From:
http://www.ise.fraunhofer.de/en/press-and-media/publications/veroeffentlichungen-pdf-dateien-en/studien-und-konzeptpapiere/study-levelized-cost-of-electricity-renewable-energies.pdf)
In the future, economies of scale and experience will gradually decrease the cost of Concentrated PV (CPV - see Science part above).  The following graph shows the cost of coal going up because of carbon taxes in the EU and the cost of PV and offshore wind declining into a range competitive with coal. (from Fraunhofer, op. cit.)

Over the same time frame, CPV and CSP (Concentrated Solar Power - see "Science" section above) will decline in price as well to a point where different situations may enable different technologies.(from European Photovoltaic Industry Association (EPIA) (Click image to enlarge)
 http://www.epia.org/fileadmin/user_upload/Publications/Connecting_the_Sun_Full_Report_converted.pdf)

The key issue with solar power is that the sun doesn't shine all the time, particularly in the Winter, and away from the equator.  The European Photovoltaic Industry Association chart has an optimistic projection of Wind and PV into 2030 for different latitudes (UK, Germany, and Italy) shows overcapacity in energy generation during the day and the need for other forms of energy generation in the evening. Wind is expected to comprise 30% of energy generation in 2030 vs. US projections of 35% for 2050. Wind power is more consistent over a day by season. Click on chart to enlarge. (from "EPIA", op. cit.)


You can see the same effect in California in May 2014 below (from
http://www.solarserver.com/fileadmin/user_upload/downloads/14-06_bc_calif.pdf:

Former US Energy Secretary Chu said in March that "as the cost of PV modules plummets and battery prices falls, it was possible to envisage a situation in five to 10 years where homeowners could be 80% ‘self-sufficient’ and off-grid with a US$10,000 to US$12,000 solar-plus-battery system."
http://www.pv-tech.org/news/former_us_energy_secretary_utilities_need_to_respond_to_disruptive_solar_pl

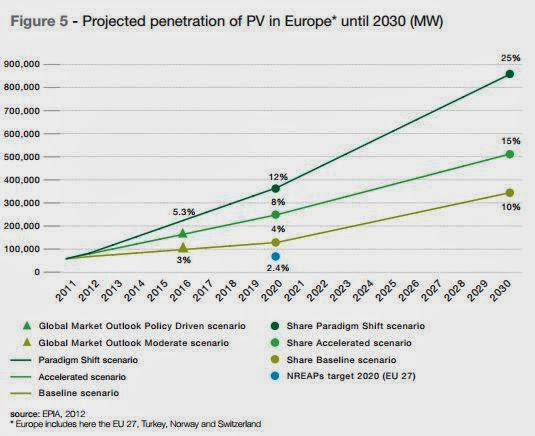
The most optimistic scenario of the EPIA is 25% of electricity demand being met by PV in Europe.  More realistic estimates are for 10%-15%.


Another problem is seasonal.  The northern hemisphere gets much less sun in the Winter. and this shows up dramatically in PV electricity production on a monthly basis (below). The ratio in irradiation (available sunlight) between Spain and Sweden is two to one  (from "EPIA", op. cit.)

This could be mitigated by placing more PV generation in the South and selling it to the Northern countries.  In the chart below, the darker regions get more sunlight and could export solar power to the northern regions. See below:(EPIA, op. cit.)


The difficulty is that about 50% of electricity is lost in transmission and in trying to send a lot of electricity north, the grid capacity would need to be greatly upgraded so overall there would be no advantage to shipping energy vast distances.  The real effect of less irradiation is to push out the year at which PV becomes economically viable for northern countries.

One problem with exporting electricity is that Europe does still not have a EU-wide grid so it is simply not yet possible to move electricity generated freely to every country that needs it - some countries can, but not all.  Storage systems are needed to absorb the mid-day peaks and use the energy later.  They have not been implemented on sufficient scale yet. Click below to enlarge (EPIA, ibid)
The above chart shows "pumped hydroelectric storage" as the most technologically proven followed by compressed air, lead-acid, Nickel-Cadmium, and NiMH, and other batteries.  Pumping water up a tower and later releasing it to draw energy from it like a mini-hydroelectric dam (currently the most viable storage) is obvious and easy, but the higher you need to pump the water, the more power it takes.  A simple flywheel for mechanical storage is also a possibility.

Interesting is the very high tech SMES - Superconducting Magnetic Energy Storage which uses inductor coils at very, VERY low temperatures (20 degrees Kelvin = -424 degrees Fahrenheit) to store a circulating current which can then be drawn on for power.  It is an ideal way to store energy since there is very little energy loss in storing, or drawing energy.  It is currently used in Wisconsin to even the loads from lumbermills which have many sharp peaks and troughs in energy use.
http://en.wikipedia.org/wiki/Superconducting_magnetic_energy_storage
Above from:
http://www.windpowerengineering.com/design/materials/why-the-wind-industry-should-cheer-superconductivity/

Another problem with generating more electricity than can be used during peak sunlight is that the grids were not designed to handle a reverse flow of electricity and voltages can overload and burn out parts of the grid.  Grids need to be re-designed.  All this costs money and is an impediment to maximum use of solar power.

Still, solar power is growing, particularly in Japan and China in 2013  The chart below also shows Saudi Arabia.  Why would Saudi Arabia invest in Solar?  Like many other oil-rich areas it subsidizes electricity for its citizens.  It currently burns its own oil to generate electricity which at today's prices is far more expensive than PV electricity, particularly given the much greater direct irradiation it gets being so near the equator.  Solar doesn't have to be cheaper than coal in Saudi Arabia, just cheaper than oil, which it already is.


After Fukushima, Japan shut down all it's nuclear reactors.  That was a lot of electricity generation so to encourage solar replacement of the lost power, "net metering"  was introduced in 2012 so roof top solar generators are paid by the utility companies for the electricity they generate.  As a result, solar cells are becoming extremely popular on Japanese roofs.  Japanese pay high rates for electricity and even the high cost of solar panels in the protected Japanese market make it very cost-effective.  The Japanese electronics companies are aggressively marketing solar panels and lowering costs to be ready for the imminent removal of import barriers.


Worldwide, "renewables accounted for more than 56% of net additions to global power capacity last year. Renewable energy provided 19% of global final energy consumption in 2012, and continued to grow in 2013. Of this total share in 2012, modern renewables accounted for 10%, with the remaining 9% coming from traditional biomass, the share of which is declining."

Above from: http://www.pv-magazine.com/news/details/beitrag/developing-countries-outpacing-leading-industrial-nations-in-global-renewable-energy-capacity_100015303/#ixzz33hQdShNt


The Rocky Mountain Institute has a study forecasting when various parts of the country could find battery-plus-PV ("Utility in a box") a viable alternative to being hooked up to the grid.  They find it is viable for Hawaii now, NY in 2025, and CA in 2031.  See chart below (from http://www.rmi.org/electricity_grid_defection#economics_of_grid_defection:)

Here is an article about a home battery installation from Solar City, made by Tesla.
A sunny future for renewable energy.